PurifyPlus™
Run-Time Analysis Tools for Application Reliability and Performance
Runtime analysis is the practice of looking at a program's behavior based on what it does when it runs. This is different from "static analysis," where you analyze program behavior by looking at its source code or high-level structure; or "crash analysis," where you look at what a program leaves behind when it fails.
Debugging is one classic example of runtime analysis: You set breakpoints, step through the program, and look at argument values and variables, all to gain an understanding of what's actually happening as the program runs. When you're debugging, you're not interested in all the possibilities of what might happen, but, rather, what really does happen. That's what separates runtime analysis from static analysis.
Debugging is highly interactive and can be powerful, but it's limited in what it can show you. That is, it's hard to identify patterns and integrate higher-level behavior when your focus is narrowed down to the size of a source line or a variable.
Testing is another kind of runtime analysis: You feed in data or events and check to see that you got the right behavior from the program. This sort of testing is the cornerstone of software quality.
Still, traditional testing only shows you so much. A program can pass all its tests (give the right answers) and still have serious quality problems.
These are the reasons that powerful runtime analysis tools like PurifyPlus were created.
-

OVERVIEW
OVERVIEW
OVERVIEW
-

FEATURES
FEATURES
FEATURES
-

PRODUCT EDITIONS
PRODUCT EDITIONS
PRODUCT EDITIONS
-

REQUIREMENTS
REQUIREMENTS
REQUIREMENTS
-

IMAGES
IMAGES
IMAGES
-

USAGE EXAMPLES
USAGE EXAMPLES
USAGE EXAMPLES
IMAGES
OVERVIEW
What is PurifyPlus?
PurifyPlus is a runtime analysis tool suite that monitors your program as it runs and reports on key aspects of its behavior:
- How much memory does it use?
- Does it leak memory?
- Does it contain memory access errors?
- How long does it take to run; where are the bottlenecks?
- What is the thread running/sleeping behavior?
- How much of the source code is actually running?
These key analysis features are all separate from the core "correctness" question: "Does it work?" and "Does it produce the right answers?" Testing can show whether your program works at all, but it takes runtime analysis tools like PurifyPlus to bring all these types of problems to light.
The major components of PurifyPlus are:
- Purify for memory usage tracking and memory error detection
- Quantify for performance analysis, code flow, and thread visualization
- PureCoverage for source code coverage analysis
Runtime analysis in the program development cycle
Runtime analysis has a place during the interactive compile-edit-debug development cycle and also in the automated builds and tests that are a key part of any project's quality plan.
Runtime analysis during development and implementation
During interactive development, Purify can report on memory errors before new code is committed to the project. Developers can use PureCoverage to identify areas where new tests are required. Quantify can reveal unexpected code paths and bottlenecks early in the development cycle.
Runtime analysis during automated testing
When running automated builds and tests, PurifyPlus lets you monitor quality and collect metrics to ensure your project stays on track. When your tests run under Purify without reporting any errors, you know your program is free of those memory access bugs and leaks. When running with Quantify shows that performance meets targets, you know you have not introduced bottlenecks. And when PureCoverage reports a high level of code coverage, you know you have not introduced new blocks of code without also adding automated tests to exercise them.
You can increase the quality of the runtime analysis data you collect during automated testing by using testing automation tools. Automated testing can give you a better depth of testing for a single iteration, and also help assess the impact of newly introduced changes on product quality. If software quality drops between two consecutive iterations of the component, runtime analysis data makes it very easy to find the responsible feature or code change.
Runtime analysis for program understanding
Sometimes runtime analysis isn't about correctness or quality at all. For example, runtime analysis can help with program understanding. Quantify, in particular, can show a call graph that reveals how the pieces of a program fit together, or it can reveal surprising paths that can explain unexpected performance degradations or interactions.
Basic PurifyPlus capabilities
As noted above, PurifyPlus has three major components: Purify for memory analysis, Quantify for performance analysis, and PureCoverage for code coverage analysis.
For C/C++ programs, Purify automatically detects and reports on memory leaks and memory access problems like using memory after you've freed it, freeing the same block twice, or reading from memory before you've initialized it. All of these are software quality issues that can lurk in a program even if its tests all pass. Problems like this can cause expensive failures in production after you release the product.
For Java and Microsoft .Net programs ("managed programs"), Purify tracks memory usage and memory references so you can see where your memory bottlenecks are, see where you are holding memory you ought to release, and compare before-and-after images to detect unintended increases in memory usage ("leaks") in the program.
Quantify tracks program performance and calling behavior, so you can see execution flow and identify bottlenecks. Quantify highlights code paths that take the longest, using the River of Time(tm) feature. In addition, Quantify lets you visualize thread execution behavior in your program.
PureCoverage tracks code coverage, so you can identify gaps in your testing and areas of your program that the runtime analysis tools are not seeing. Since Purify and Quantify only see the code that actually runs, the code coverage metrics provided by PureCoverage are critical to knowing that you are verifying and improving quality across your whole project.
FEATURES
- Advanced memory debugging: Locates the cause of memory corruption errors and provides detailed information, such as the error location (function call stack) and the size of the affected memory.
- Memory leak protection: Improves memory utilization and speeds debugging time.
- Application performance profiling: Highlights application performance bottlenecks and improves application understanding with a graphical representation of function calls.
- Code coverage analysis: Identifies untested code with line-level precision.
- Binary instrumentation technology: Allows integration with third-party libraries and does not require access to source code.
PRODUCT EDITIONS
PurifyPlus Enterprise Edition: A packaged bundle of PurifyPlus for Windows® and PurifyPlus for Linux® and UNIX®.
PurifyPlus for Linux and UNIX: A dynamic software analysis toolset for UNIX-based C/C++ development.
PurifyPlus for Windows: A dynamic software analysis toolset for Windows application development.
REQUIREMENTS
![]()
WINDOWS
REQUIREMENTS
![]()
LINUX/UNIX
REQUIREMENTS
Hover on an operating system to view system requirements.
The following information lists the basic software requirements for using PurifyPlus for Windows.
| Operating System | Hardware |
|---|---|
|
Microsoft Windows 11 |
Intel IA-32 Intel 64 AMD 64 |
| Compiler Support | ||
|---|---|---|
| Data Collection Type | Processor Architectures | Supported Compilers and Runtime Environments |
| C/C++ (unmanaged code) data collection | Intel IA-32 Intel 64 AMD 64 |
Microsoft Visual Studio® 2010 through 2022 |
| .NET (managed code) data collection | Intel IA-32 Intel 64 AMD 64 |
Microsoft .NET® Framework versions 3.0, 3.5, 4.0 used with the following: Microsoft Visual Studio® 2010 through 2022 |
| Java™ code coverage data collection |
Intel IA-32 |
IBM® JRE 5 through 8 Sun JRE 1.5 through 1.8 |
The following information lists the basic software requirements for using PurifyPlus for Linux/UNIX.
| Operating System | Software | Hardware |
| Solaris® 11 base through 11.4 | Sun C/C++ 5.10 through 5.15 GNU gcc/g++ 4 and 5 |
Sun UltraSPARC® |
| Solaris 11 base through 11.4 | Sun C/C++ 5.10 through 5.15 GNU gcc/g++ 4 through 8 |
AMD64™ Intel® 64 |
| Solaris 10 base through U11 | Sun C/C++ 5.10 through 5.13 GNU gcc/g++ 4 and 5 |
Sun UltraSPARC |
| Solaris 10 U6 through U11 | Sun C/C++ 5.10 through 5.13 GNU gcc/g++ 4 through 8 |
AMD64 Intel 64 |
|
RHEL 8 (Server/Desktop) base through 8.7 |
GNU gcc/g++ 4 through 8 Intel icc 11.0 through 11.1 Intel icc 10.1 |
Intel IA-32 |
| RHEL 8 (Server/Desktop) base through 8.7 RHEL 7 (Server/Desktop) base through 7.9 RHEL 6 (Server/Desktop) base through 6.10 SLES 12 base through SP4 SLES 11 base through SP3 |
GNU gcc/g++ 4 through 8 Intel icc 11.0 through 11.1 Intel icc 10.1 |
AMD64 Intel 64 |
USAGE EXAMPLES
Examples of runtime analysis with PurifyPlus
The major goals of debugging are to find the root cause of defects and understand application behavior.
Runtime analysis provides additional capabilities that supplement traditional debugging:
- Visualization of application execution.
- Measurement of vital runtime parameters, including memory usage, performance, and code coverage.
- Error detection in user code.
- Documentation of runtime behavior.
-

VISUALIZATION
VISUALIZATION
VISUALIZATION
-

MEASUREMENT
MEASUREMENT
MEASUREMENT
-

ERROR DETECTION
ERROR DETECTION
ERROR DETECTION
-

DOCUMENTATION
DOCUMENTATION
DOCUMENTATION
VISUALIZATION
Visualization example 1: Code coverage
Runtime analysis with a tool such as PureCoverage® (included in PurifyPlus) provides various views to code coverage information, one of them being Annotated Source. This particular view shows the source file of the examined application; the color of the line indicates the line's status after the executed test case: hit, missed, dead, or partially hit.
As Figure 1 shows, the user can see code coverage and the execution path for this test case.
The code fragment in Figure 1 shows the exact path the application took when executing the switch statement on line 111. This particular line is marked as partially hit because line 122 hasn't been executed.
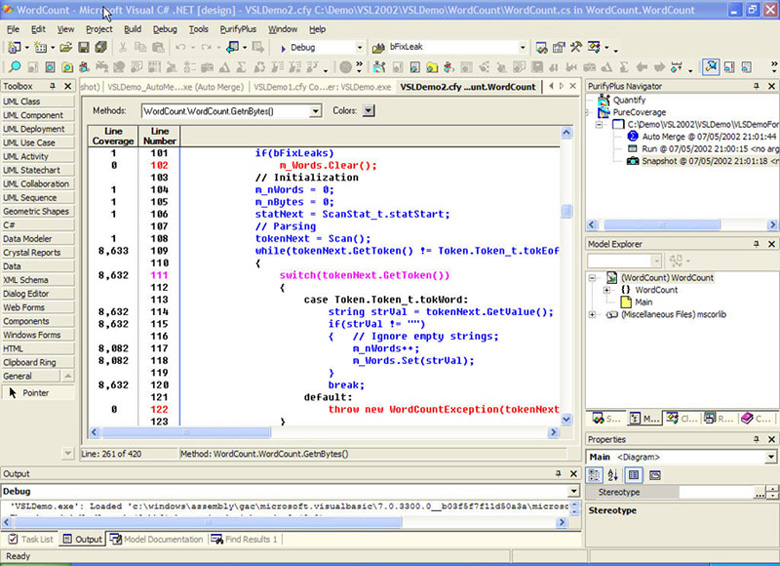 Figure 1: PurifyPlus display of annotated source for the C#.NET application in Visual Studio.NET
Visualization example 2: Threads
A runtime analysis tool such as Quantify (included in PurifyPlus) provides thread visualization, which can assist in detecting multithreading problems by marking the state of each of the threads while debugging. As Figure 2 shows, this allows you to examine the status of threads visually, while debugging.
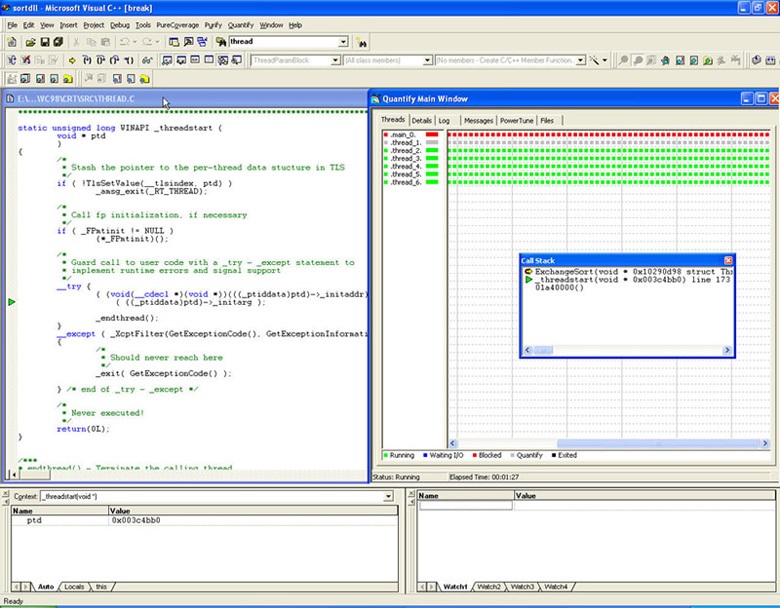 Figure 2: Quantify thread analysis view in Visual Studio 6
Visualization example 3: Call graph
Runtime analysis tools can also detect and display performance bottlenecks. The big advantage of this approach, compared to traditional methods, is that you can get an excellent overview of the execution path as well as precise information about the number of calls to the methods involved in the scenario. As Figures 3A and 3B show, the Call Graph in Quantify highlights a chain of calls in the most time-consuming execution path; that is the performance hotspot. The thickness of the line connecting methods is proportional to the ratio between the time (or memory if you are using Purify) spent in this chain of calls and the rest of the application.
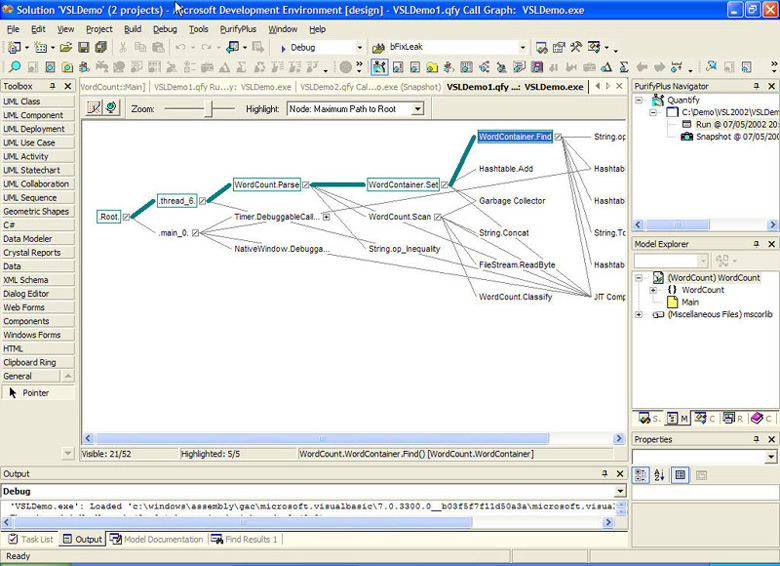 Figure 3A: Quantify call graph of a mixed VB.NET and C#.NET application in Visual Studio.NET
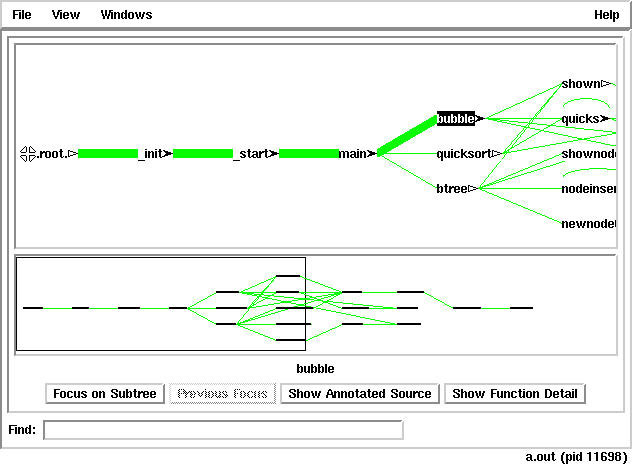 Figure 3B: Quantify call graph of a C/C++ application on Solaris
Visualization example 4: Memory usage
The first step in handling memory leaks is to detect them. One very intuitive way to do this is to visualize overall memory usage and take snapshots of memory in the program under test (PUT). This lets you see potential memory leaks in the running application. (This feature is available in Purify for Java and .NET managed applications.) For example, if snapshots of memory usage for the component running on the server show that overall memory usage increases after each client session, then it is very likely that this component leaks memory (see Figure 4).
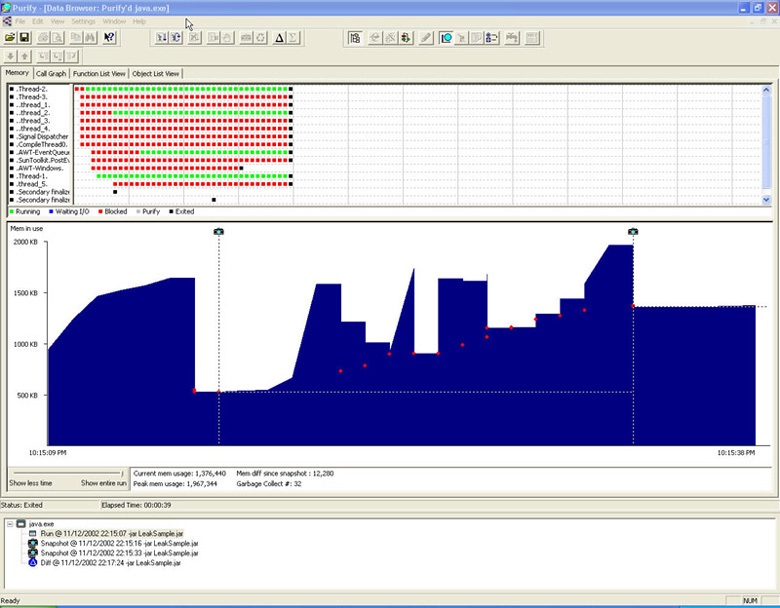 Figure 4: Overview of thread status and memory usage in Purify for Windows
MEASUREMENT
Visual error detection is just the first stage of runtime analysis. We also need to understand exactly what happens during the run. For that purpose, runtime analysis should be based on exact measurements of parameters vital for the application's execution:
- Runtime performance
- Memory usage
- Code coverage
Again, we will look at examples to understand this runtime analysis capability.
Measurement example 1: Function list view
Function List View is a typical runtime analysis view that can be generated with a specialized Runtime analysis tool such as Quantify (see Figure 5). It presents all important methods and/or objects of an application in tables that can be sorted by number of measured parameters; this allows developers analyzing code to find what methods used the most available memory at that point in time, as well as the slowest functions, the age of objects, and so forth.
This view provides exact information about the number of calls to methods, time spent in methods only, time spent and memory accumulated in selected methods and all their descendants, and so on.
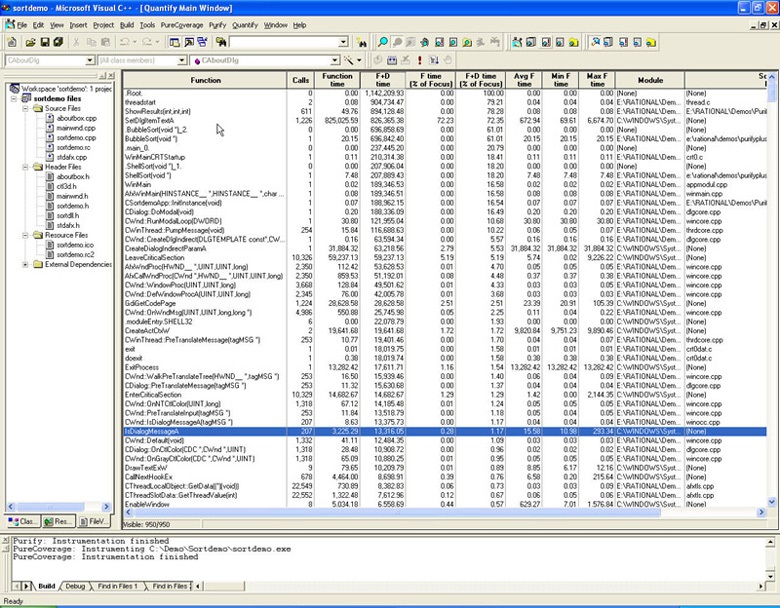 Figure 5: Quantify function list view for a Visual C++ Application
Measurement example 2: Function detail view
A runtime analysis tool such as Quantify can also extend the information in Measurement Example 1 to include information about the distribution of measured data between calling methods and descendants. This is shown in the Function Detail View (Figure 6). This view highlights callers and descendants that contribute to a performance or memory hotspot -- information that can help detect the exact cause of a performance or memory bottleneck.
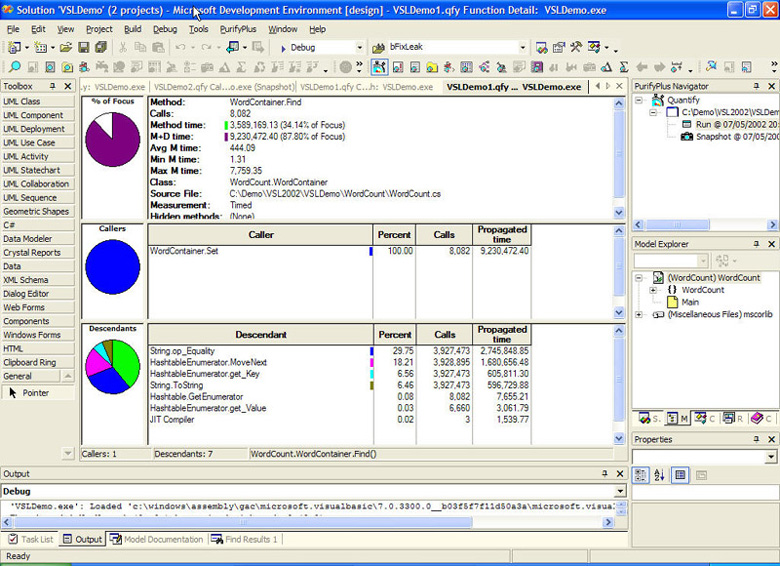 Figure 6: Quantify function detail view for a Visual C#.NET application in Visual Studio.NET
Measurement example 3: Method coverage module view
As we explained earlier, in some cases -- and especially when assessing the value of available testing methods -- it is useful to measure the percentage of code covered while testing, or simply to mark all the methods that haven't been tested after a series of tests. You can do this with a tool such as PureCoverage®, which yields precise information about untested and dead code vs. tested code (Figure 7).
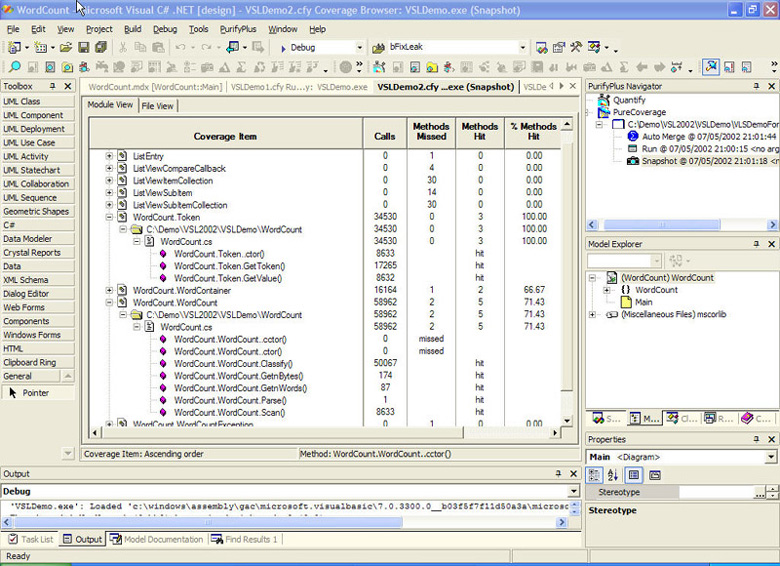 Figure 7: PureCoverage display of code coverage on the method level for a mixed C#.NET and VB.NET Application in Visual Studio.NET
ERROR DETECTION
This is the crowning glory of runtime analysis for native C/C++ applications. Runtime analysis can not only help to detect problems by displaying performance, memory, thread, and code coverage data in different views, but it can also pinpoint the exact location in the user code where the error is generated and/or caused. Runtime memory corruption detection is essential to ensure proper functioning and high quality of native C and C++ applications on all platforms. UNICOM tools for runtime memory detection are Purify and PurifyPlus. Again, let's look at some examples.
Error detection example 1: Purify memory error and memory leak reports
Purify can pinpoint the exact line of code where a developer has created a memory error. It doesn't even need source files to provide this information; Purify detects errors in memory and uses debug information to trace these errors back to the responsible lines of code (see Figure 8).
In this particular example, the developer forgot to take the termination string into consideration when building an array variable. This error was causing the release build of the application to crash, whereas the debug build worked fine. This example is just one of the many ways in which runtime analysis significantly reduces debugging time for C/C++ development.
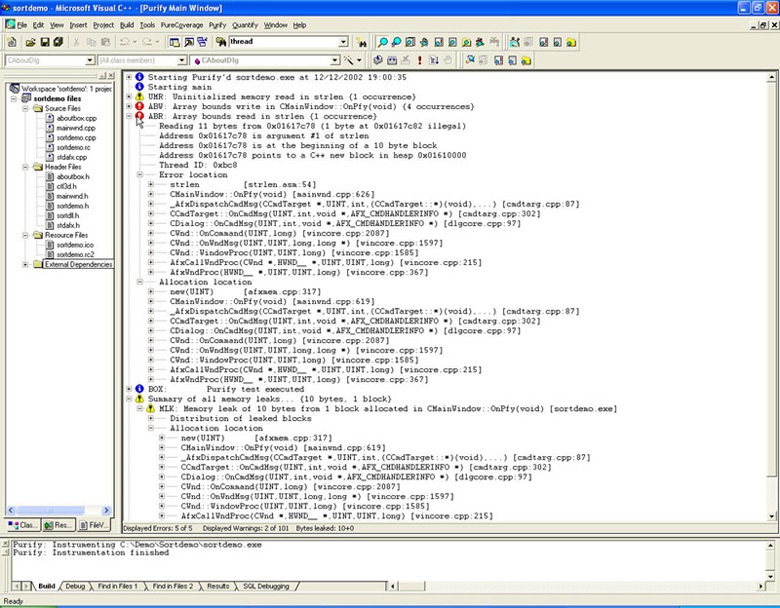 Figure 8: Purify memory error and memory leak report for a Visual C++ application
Error detection example 2: Quantify annotated source
Quantify has a unique capability to measure distribution of time recorded for each of the user methods per line of code. Quantify annotated source displays times measured for each line of code, along with times spent and inside functions called on the line. This information can help you narrow the performance bottleneck down to an individual line of code (Figure 9).
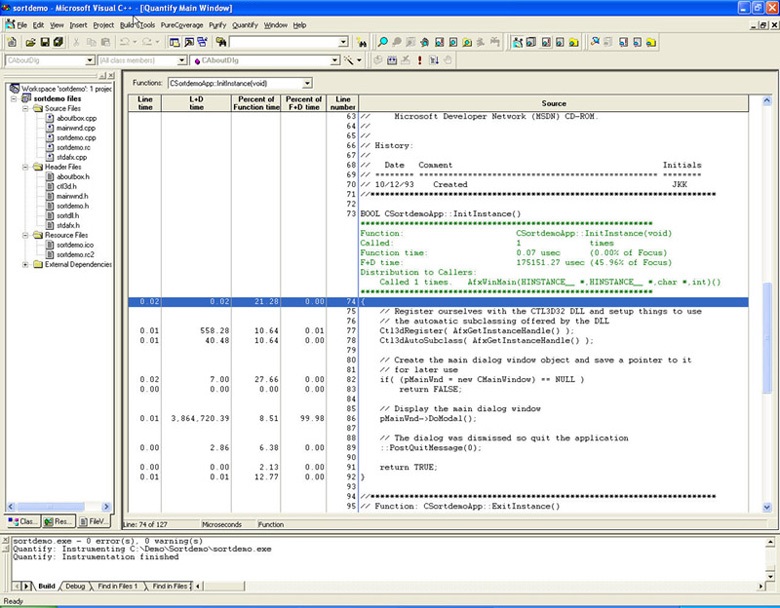 Figure 9: Quantify annotated source for a mixed visual Basic 6 and Visual C++ application in Visual Studio 6
Error detection example 3: Purify object and reference graph
In Java and .NET managed code, it is not possible to make runtime memory errors such as out of bounds reads and writes and free memory reads and writes, because the automatic memory management in the runtime subsystem prevents developers from directly accessing allocated memory. However, this automated memory management doesn't prevent programmers from forgetting references to the objects' allocated memory. As long as there is a reference to such dynamically allocated objects somewhere in the code, they will stay in memory and will not be cleaned by the automatic memory management (garbage collector). The net effect of such errors is the same as the effect of C/C++ leaks: The memory becomes unavailable for this and all other processes running on the host operating system. By doing a runtime analysis with Purify, however, you can pinpoint the exact line of code where the reference to the object in question has been created (Figure 10).
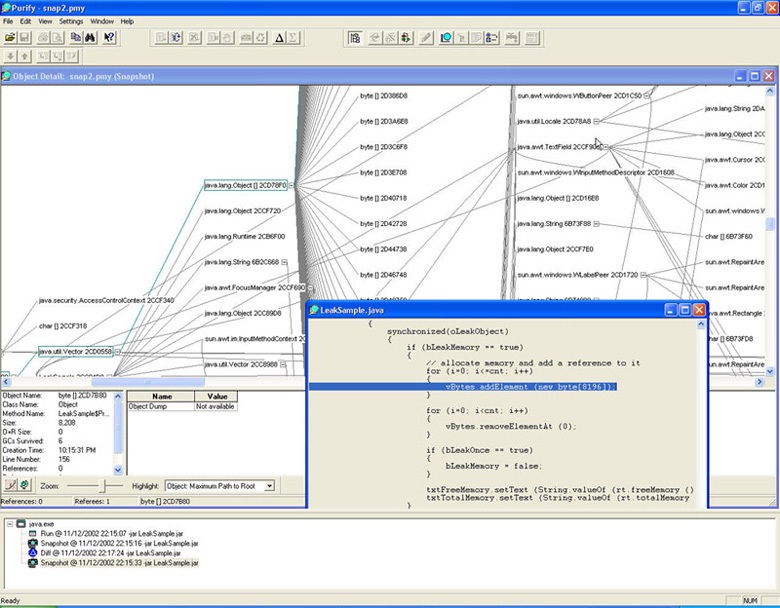 Figure 10: Purify object and reference graph for a Java application
DOCUMENTATION
Yet another way to leverage runtime analysis is by documenting the application's runtime behavior for future use. This helps you assess the overall quality of the project and measure the influence of newly introduced features and code changes on overall application performance, reliability, and test harness completeness. This advanced way of practicing runtime analysis involves collecting runtime data for each iteration of the component or application under development and analyzing the data at different stages in the project lifecycle. This information can help in determining overall project quality as well as the effect of new feature additions and bug fixes on overall quality.
Advanced runtime analysis tools such as PurifyPlus provide features to analyze multiple test runs by, for example, allowing the user to merge code coverage data from various tests or test harnesses, or to create separate data sets for comparisons of consecutive iterations of test measurements, as shown in Figure 11.
In Figure 11, Quantify compares two data sets and highlights chains of calls where performance has improved (green line) and chains of calls where performance has dropped (red line). The calculated data is available in both the Call Graph view and in the more detailed Function List view.
Even if you are not in a position to create an automated test environment, you can still automate data analysis by taking advantage of runtime analysis data saved as ASCII files. Figure 12 shows an example of a performance profile imported into Microsoft Excel.
You can easily automate data analysis in Excel by creating simple Visual Basic applications, or with any of the popular scripting languages: Perl, WSH, JavaScript, and so on. PurifyPlus for UNIX comes with a set of scripts that can help you manage and analyze data collected from various tests.
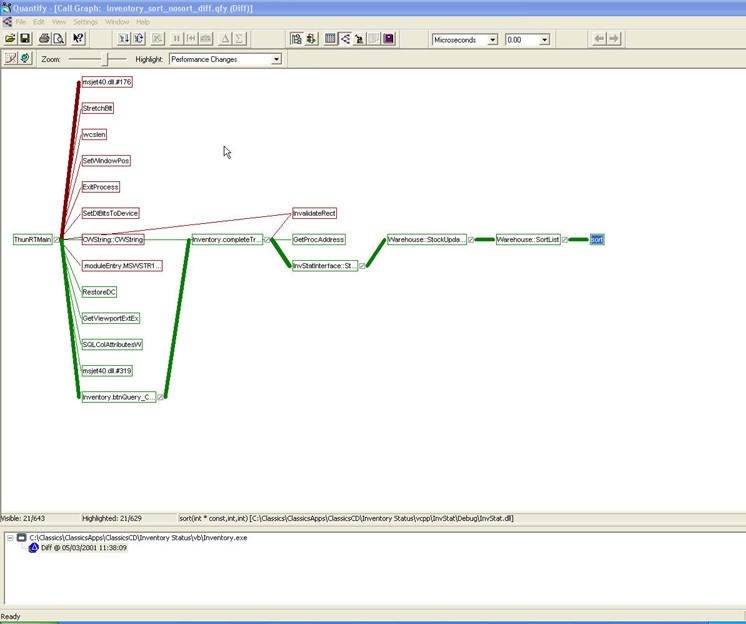 Figure 11: Quantify compare runs report
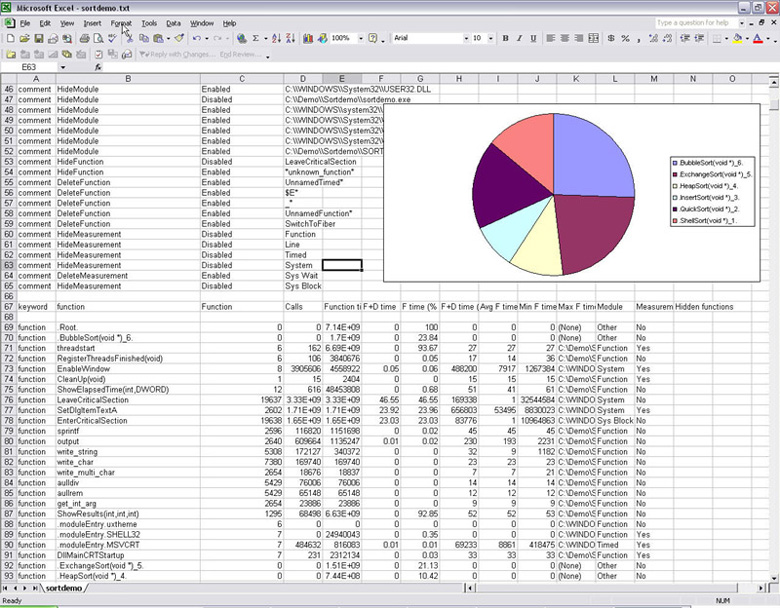 Figure 12: Quantify performance report imported into Excel